Application Analysis
Application Analysis lets you create application snapshots by gathering information maintained by the selected application and its database tables. The application analysis page displays application metrics, data volume statistics, and reports. It also allows administrators to compare snapshots from across system applications.
Create an Application Snapshot
-
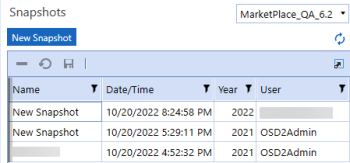
Click New Snapshot to populate an application snapshot.
-
A pop-up dialog prompts you to enter the Data Volume Year (the year to which the data volume statistics apply), Data Volume Detail (the number of top records recorded for the data volume statistics), and Snapshot Name. The snapshot name defaults to New Snapshot if you leave the snapshot name blank.
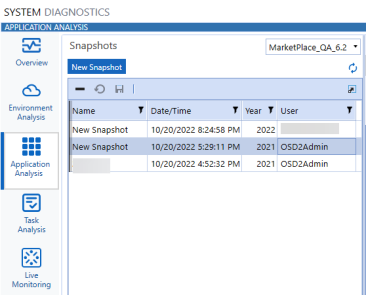
The new snapshot displays on the left side of the dashboard panel.
To change the snapshot name, select the name field, change the name, and click  . To delete a snapshot, select the snapshot name and then click
  .
.
NOTE: You must click the save icon after making any changes, including deleting a snapshot, for your environment to update.
Application Metrics
This section shows the application metrics that are considered key stakeholder drivers for the general performance of an application. You can click on any row in the Application Metrics grid to view additional details of the records in that metric.
Stored Formulas: Applications that have many stored formulas may notice a consolidation performance impact. Green Status: Less than 1000, Orange Status: 1000-2000, Red Status: Higher than 2000.
Dimensions with over 1000 Members: Multiple dimensions greater than 1,000 members can result in a large and sparse data model which can impact consolidation and reporting performance. Green Status: Less than 2, Orange Status: 2-3, Red Status: Higher than 3.
Members with Auto-Translate Currencies: Applications that use the Entity Auto Translate property will have reduced consolidation performance. Green Status: 0, Orange Status: 1-20, Red Status: higher than 20.
Cubes with Non-Standard Consolidation or Translation Algorithms: Applications that use non-standard consolidation or translation algorithm types may have reduced consolidation performance. Green Status: 0, Orange Status higher than 0. No Red status.
Attribute Members: Applications that have greater than 500 attribute members will have a negative impact on consolidation performance. Green Status: 0, Orange Status: 0-500, Red Status: higher than 500.
Number of Stored Records for Largest Data Unit: Data Units larger than 500,000 records may cause consolidation and reporting performance degradation. Green Status: less than 1,000,000. Orange Status: 1,000,000-2,000,000. Red Status: Higher than 2,000,000.
Number of Stage Records for Largest Workflow: Workflows with more than 1,000,000 finance load result records may result in reduced stage performance. Green Status: 1,000,000. Orange Status: 1,000,000-1,500,000. Red Status: higher than 1,500,000.
One to One Entity Relationships: Entity hierarchies with numerous one to one parent child relationships can result in poor consolidation performance. Green Status: 0, Orange Status: 1-5, Red Status: higher than 5.
Number of Closed Cube Root Workflow Profiles: Closed workflow profiles may cause reporting and navigation performance degradation. Green Status: 0, Red Status: greater than or equal to 1.
Number of Active Finance Rules and Member Formulas Using BRApis: Finance Rules and Member Formulas that use BRApi functions can result in a degradation of consolidation performance becaisethese functions need to open a database connection. Consider using API function equivalents whenever possible. Green Status: 0, Orange Status: 1-10, Red Status: Higher than 10.
Number of Active Finance Rules and Member Formulas without Consolidation Conditions: Finance Rules and Member Formulas without consolidation if conditions can result in a degradation of consolidation performance because the rule may needlessly run at multiple levels of the consolidation dimension. Green Status: 0, Orange Status: 1-10, Red Status: Higher than 10.
Number of Active Finance Rules and Member Formulas without Entity Conditions: Finance Rules and Member Formulas without entity if conditions can result in a degradation of consolidation performance because the rule may needlessly run for both base and parent entities. Green Status: 0, Orange Status: 1-10, Red Status: Higher than 10.
Number of Active Finance Rules and Member Formulas Using Error Logging: Finance Rules and Member Formulas that have active error logging still commented in can result in a degradation of consolidation performance because these rules write to the error log during a consolidation. Green Status: 0, Red Status: Higher than 0.
Number of Active Finance Rules and Member Formulas that Execute Api.Data.Calculate within a For Each Loop: Finance Rules and Member Formulas that execute an Api.Data.Calculate within a For Each Loop can result in a degradation of consolidation performance due to the inefficiencies of looping through a list of the opening of a data unit potentially many times in memory.
Potential Number of Stored Data Cells for Largest Data Unit: Represents the maximum number of data cells for this data model.
Application Metrics Status
|
Status |
Description |
|---|---|
Ok  |
Indicates that the metric does not affect application performance. |
Warning  |
Indicates that the metric may negatively affect application performance. |
Critical  |
Indicates that the metric is negatively affecting application performance. |
Data Volume Statistics
This section reflects on the data volume detail of the application based on the year selected for the snapshot.
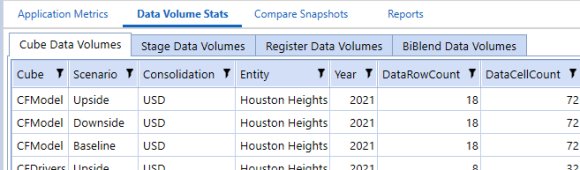
Cube Data Volumes: Reports on the cube, scenario, entity, and year combinations with the most data volume rows in the DataRecord database tables.
Stage Data Volumes: Reports on the workflows with the most data rows in the stagetofinanceloadresult database table.
Register Data Volumes: Reports on workflows with the most records that are found in the installed Register Plan database tables.
BiBlend Data Volumes: Reports on BiBlend data volumes in the StageBIBlendInformation database table.
Application Analysis Reports
Application Analysis reports are based on the selected snapshot time period.
Database Table Sizes: Summarizes application table sizes by row count, used space, unused space, and allocated space.
Long Running Formulas: Reports on any long-running formulas logged in the error log during the previous 30 days from when the selected snapshot was taken.
MarketPlace Solution Deployment: Reports on all the deployed MarketPlace solutions in the current application when the selected snapshot was taken.
Snapshot Summary: Summarizes all the snapshot data found in the application metrics and data volume statistics tabs into one PDF report.
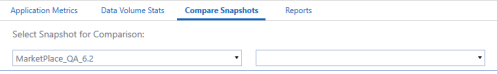
Compare Application Snapshots
Click Compare Snapshots to compare any two application snapshot metrics. You can compare snapshots in the same application or different applications.
-
Select a snapshot from the table on the left to be the original snapshot.
-
-
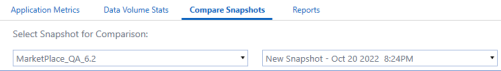
Select the application you would like to choose your comparison snapshot from the snapshots list grid on the left.
-
Select the snapshot you would like to compare to the original.
Auto-created Task in Task Scheduler
When the solution's tables are first set up, a task called System Diagnostics Snapshot Automation is created in Task Scheduler. Task Scheduler is only viewable on OneStream Desktop. This task runs monthly on the third Saturday of the month at 11:30 PM UTC. The task takes an environment snapshot and also takes an application snapshot for the application where System Diagnostics was deployed.
If other applications in the same environment already have a System Diagnostics solution installed, a new System Diagnostics install in another application results in the task being scheduled to run 30 minutes before the existing System Diagnostics tasks in the environment to ensure environment resources are not exhausted by having several application snapshots run at the same time.
See also: Create Tables
Modify the Task
Administrators can modify the Snapshot Automation OSD task to change the frequency or scheduled time of the automated snapshot:
-
Navigate to the Task Scheduler page in OneStream (Application > Tools > Task Scheduler).
-
Select the task called Snapshot Automation OSD and click Edit.
-
Click the Schedule tab and change the frequency and scheduled time. See the Task Scheduler section in the Design and Reference Guide for more information on using the Schedule tab.
Re-create the Task (After Deleting)
If the task gets deleted for any reason, and the administrator wants to re-create the task, there are two options.
-
Find the dashboard 0_Frame_OSDS under the dashboard group Solution Setup (OSDS) and run it. Then click Setup Tablesto create the task.

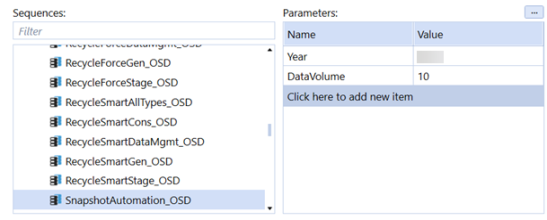
-
Manually create a task with the frequency needed and select the SnapshotAutomation_OSD sequence. Then set the Data Volume parameter to 10, as shown below: